

The way consumers are finding products, interacting with brands, and making purchase decisions is changing. Thanks to Twitter and Facebook, a small business doesn’t only have to rely on SEO to compete with their larger competitors. Larger retailers are able to spotlight specific products in front of a relevant audience using data insights. Businesses are marketing smarter as a result of consumers gaining the ability to make more informed decisions.
This week, Yotpo released its first annual State of e-commerce benchmark report. We pulled data from 65 million orders and two billion dollars in transactions across over 120,000 e-commerce stores. This represents stores of all sizes among thousands of verticals and range from single founder startups to multi-million dollar businesses with hundreds of employees.
This data, which covers traffic quality and quantity, mobile vs. non-mobile traffic and commerce, the value of customer loyalty and the impact of reviews, is intended to help e-commerce companies do their best online business. We’ll identify which traffic is bringing the best visitors with statistics on desktop and mobile distribution by sources as well as engagement benchmarks and customer retention and reviews stats.
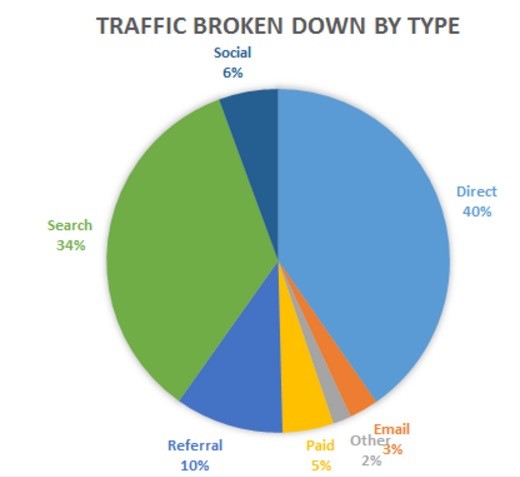
Traffic: Where is it coming from, and is it quality?
We mention earlier that small businesses can take advantage of social channels to engage with customers. Direct, search and referral traffic still trump social traffic in percentage with 40 percent, 34 percent and 10 percent respectively.
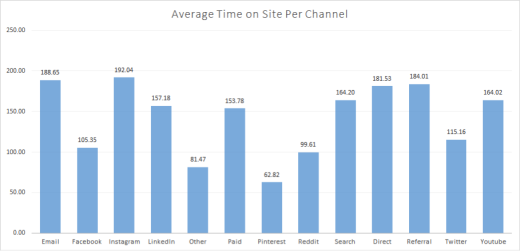
However, you can’t deny the quality of social traffic. Instagram traffic is the leading traffic source for average time on site, which comes in above email, direct and referral traffic.
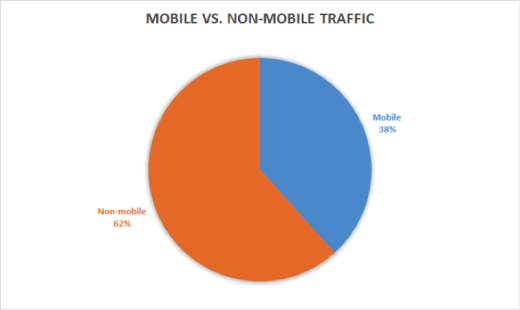
Mobile vs. Non-mobile: Where should you focus?
While non-mobile traffic still exceeds mobile traffic, the latter is gaining ground. At 38 percent of traffic, it’s critical for online businesses to optimize their content and marketing to that audience.
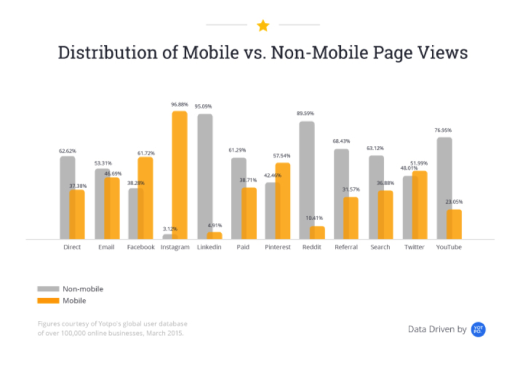
There’s also a clear distinction on which sites are driving mobile vs. non-mobile traffic. For example, 95 percent of LinkedIn traffic comes from non-mobile devices. Not surprisingly, the opposite is true for Instagram; 97 percent of the traffic coming from Instagram (one of the most quality traffic channels with regard to time on site) is from mobile.
Email traffic is almost an equal split with 47 percent of traffic coming from mobile, illustrating the importance of optimizing marketing emails for mobile.
Customer Loyalty: How much is it worth?
You’ve probably heard keeping a current customer is more cost effective than trying to get a new one, but when it comes down to actual spend, just how much is customer loyalty worth?
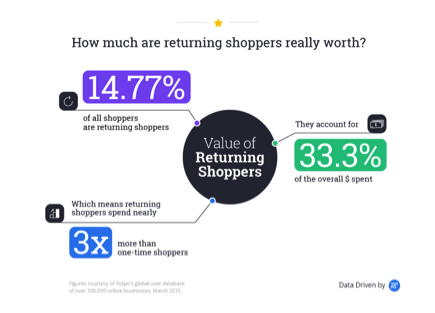
The data shows that it’s worth a businesses’ time to improve customer retention, because returning customers really pay off. Repeating shoppers have spent $356 million during 2014 out of a total of $1.07 billion spent by customers during 2014, which is 33.3 percent of the overall spend.
On average only 15 percent of customers are repeat shoppers, yet these customers account for one-third of the total spend. Returning customers spend 2.92 times more than one-time shoppers, with an average of 41 days between purchases.
Reviews and Star Ratings: How do they impact e-commerce?
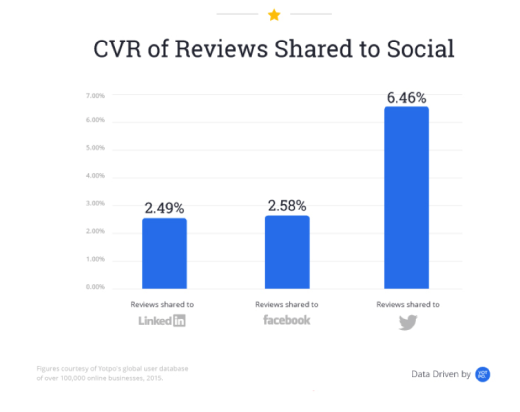
This just in: reviews help conversion rates. Taking our analysis of social traffic a step further, it’s clear that companies can get a leg up by sharing user reviews to their top three social channels. LinkedIn, Twitter and Facebook conversion rates beat the industry standard of two percent when reviews are shared. Twitter takes the cake with over six percent conversion rate.
And how do star ratings influence customers’ future behavior? According to one million reviews for 8.6 million purchases made on 6,623 products across multiple verticals and stores, more stars really do lead to more sales. The data shows that products with higher star reviews have a much higher volume of purchases and more reviews.
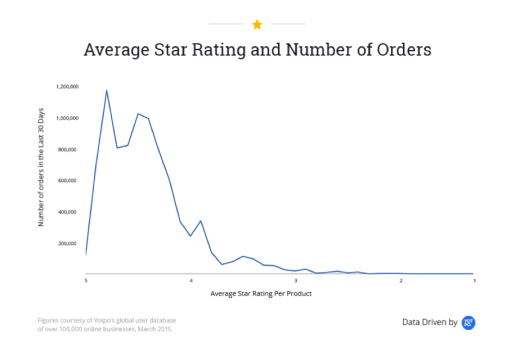
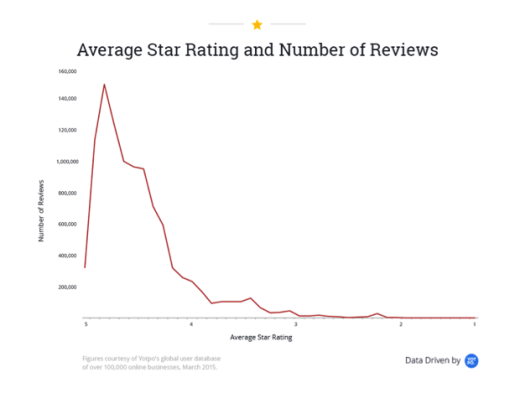
This shouldn’t come as a huge surprise, but it’s sobering to see the drop off. It’s noteworthy because the quantity of reviews has a big influence on people’s purchase decision.
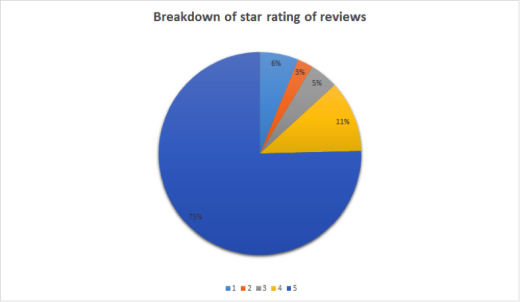
Also interesting, 75 percent of reviews from the 65 million transactions we analyzed received five stars.
We can conclude from this data that businesses should stop worrying about negative reviews. It’s more important for consumers to see more reviews, than a perfect 5-star record. We also know that negative reviews can still have positive effects.
In the end, there’s no denying that mobile and social are changing e-commerce, and that reviews are impacting people’s purchase decisions. We encourage businesses to apply the data here to best practices they’ve learned along the way. Don’t ignore what’s working, and what isn’t, for 120,000 online businesses.
Head here to view the full report.
Image credit: Shutterstock
by AIMEE MILLWOOD via TheNextWeb